Better Summary Reporting
→ Product design intern
→ May 2021 - July 2021
→ DashXL Team
Skills
Product thinking, computer networking, market analysis, interaction design, user experience, user research, persona mapping.
About
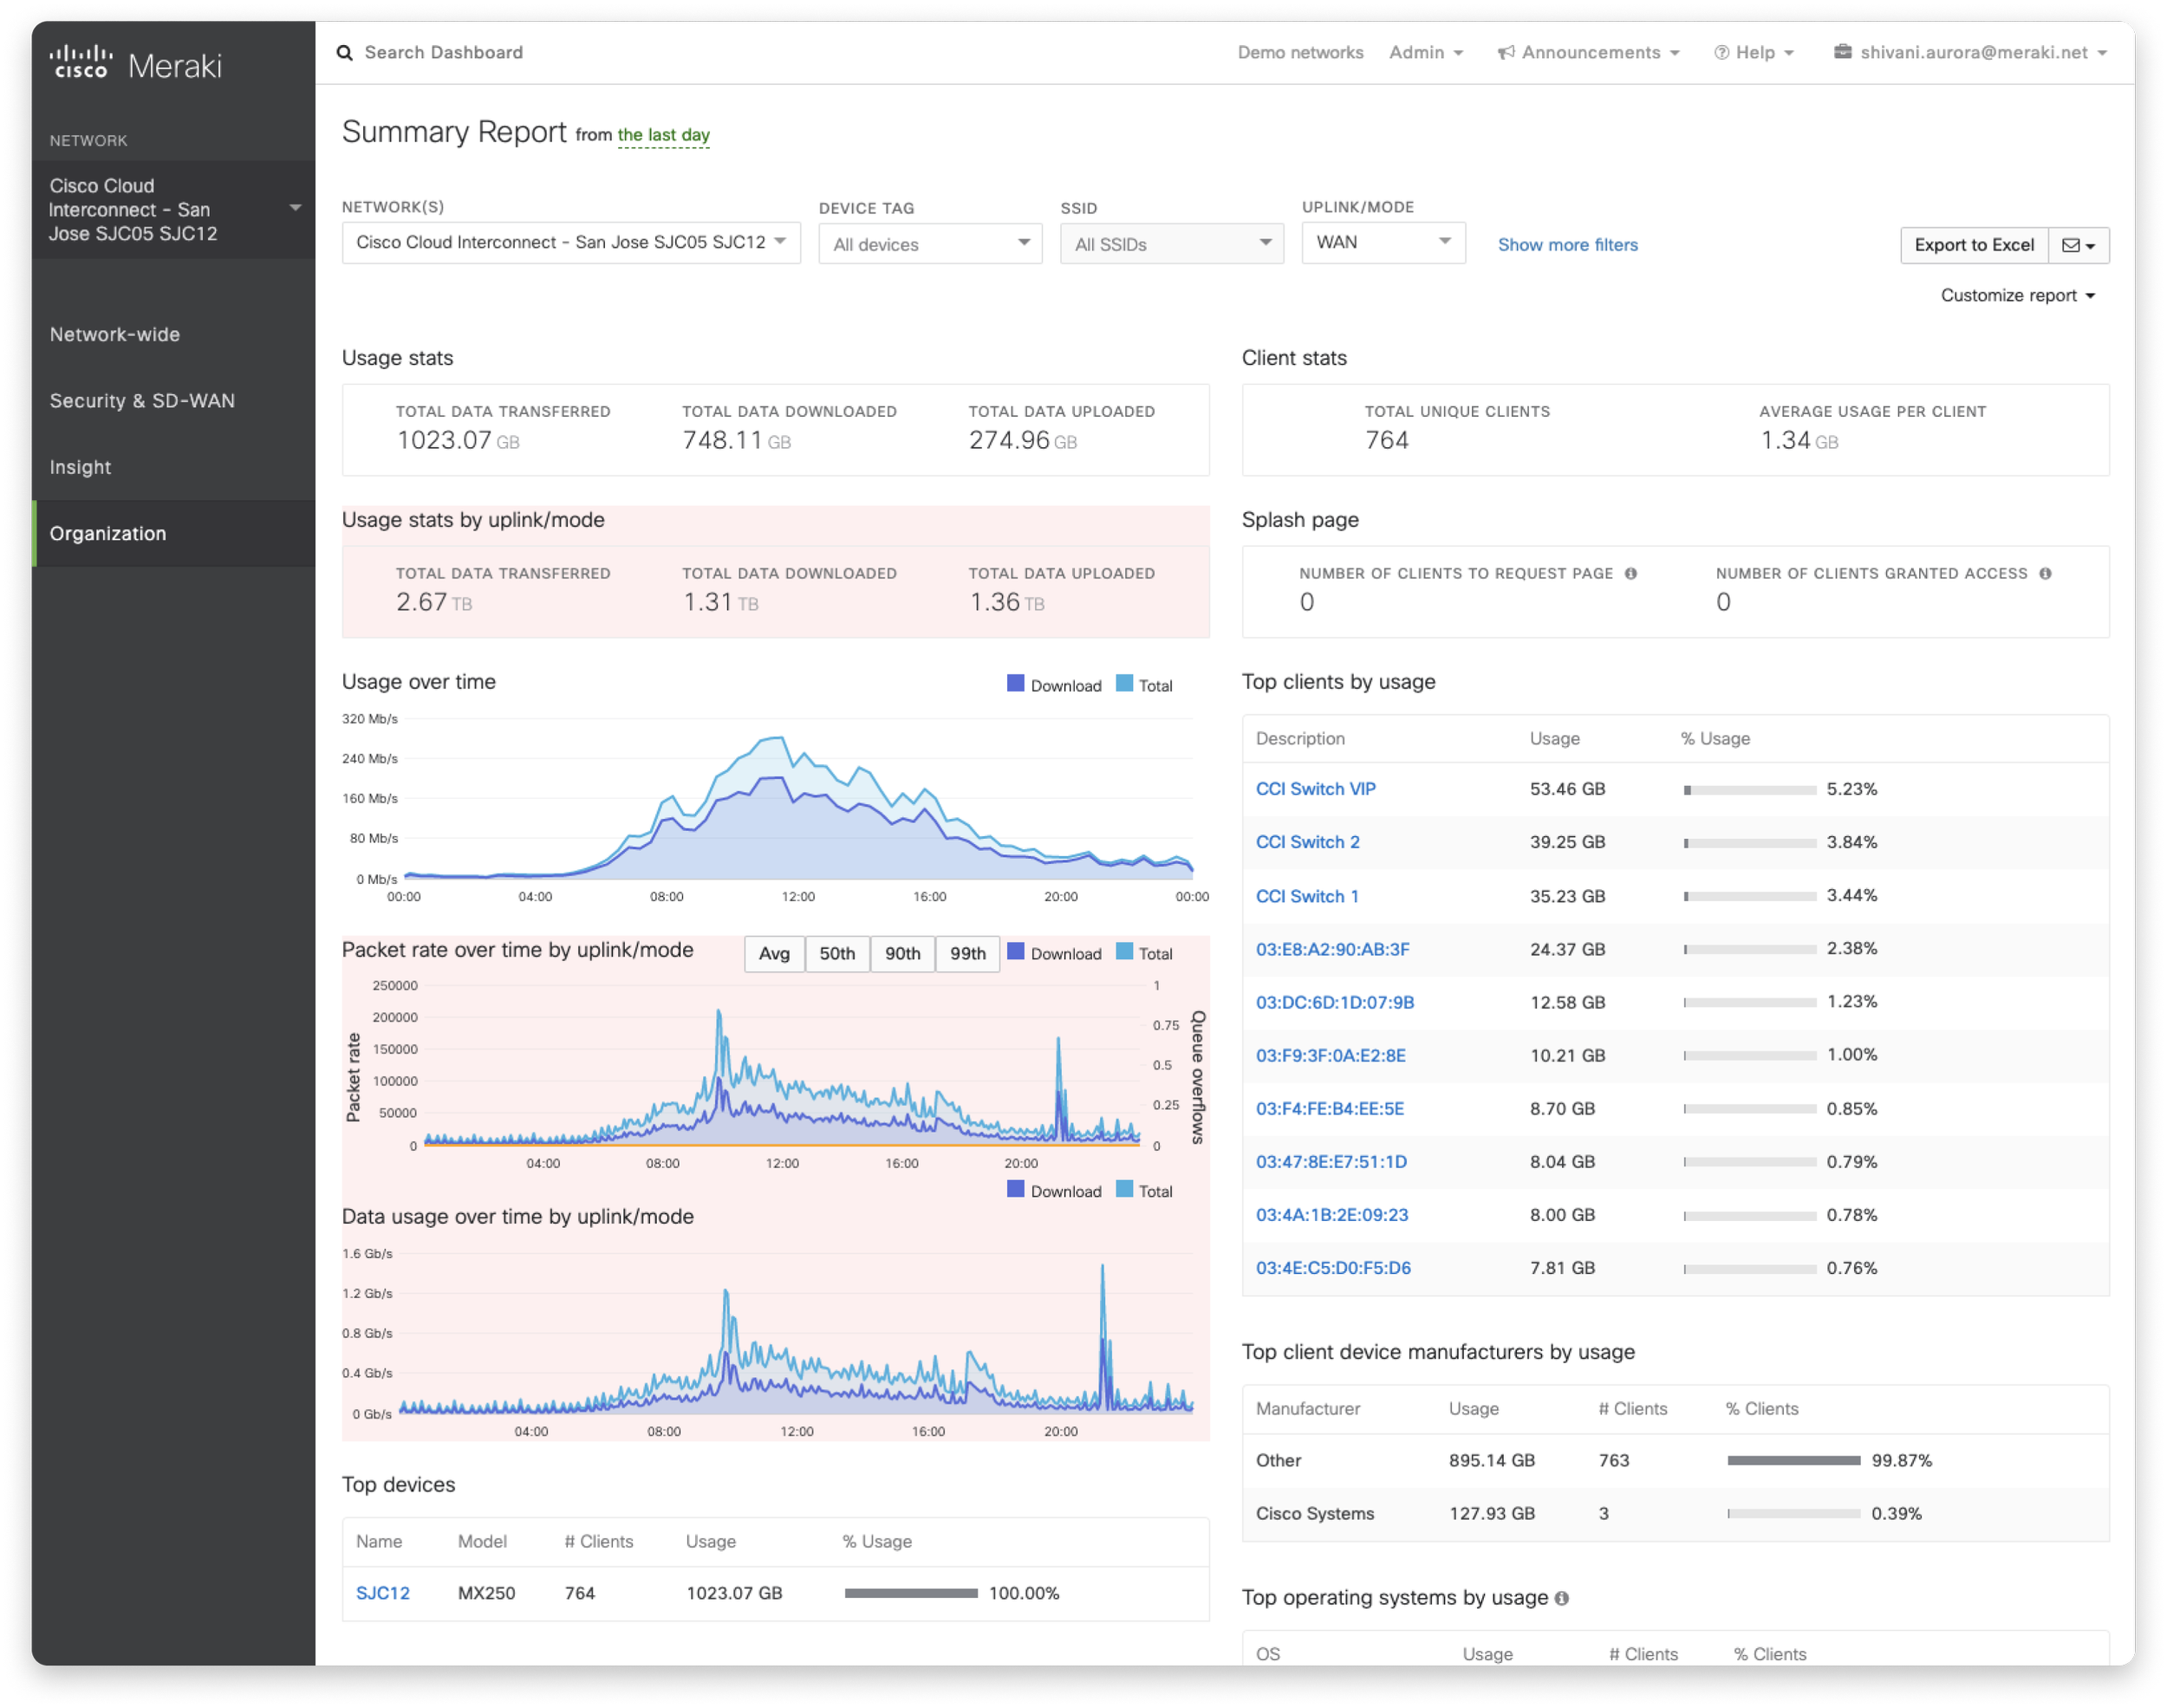
During my internship, I was tasked with redesigning an existing page on the Cisco Networking dashboard. I completed both a content, and design-related phase to understand what people love, what they’re struggling with, and what workflows and metrics we weren’t supporting in comparison with our competitors.
Let’s start with some networking terminology.
Network
A group of interconnected devices that exchange data with each other within a space.
Eg. Starbucks 462 Powell St
Organization
A group of networks, often utilized across campuses, branches and data centers.
Eg. Starbucks San Francisco
The problem
Some of Cisco largest customers, including Enterprise and Service Providers, find themselves in the unique situation of needing to manage multiple distinct customer organizations on the Meraki Dashboard. The current Summary Report page is designed for managing a single organization and does not enable our large customers to have a cross-organizational perspective.
The solution
To provide users with access to an overview of key metrics across multiple organizations, empowering them to gain valuable insights for their unique use-cases at a cross-organizational level.
User goals
Monitor
Allow users to stay on top of the numbers, and identify any discrepancies/issues early.
Plan
Empower users to view notable trends in order to plan for future needs.
Share
Give users the ability to export, print and share reports with the team to provide insights at a glance.
Content
Competitive audit
I created a competitive audit as a form of foundational research. The auditing process helped us to better understand our competitors, identify key industry standards and best practices of reporting, and highlight noteworthy user experiences. It also acted as a guide for establishing key metrics to feature on the Summary Report page.
Competitive audit takeaways
Filterability
Filtering is key for administering drill-downs on summary reports, especially those with heavy content requirements.
Customizability
Provide clear answers to users’ questions and accommodate to their levels of expertise.
Simplicity
All possible user actions must always be visible. We must also feature a minimal number of elements on screen.
Metric analysis
We created a reporting exploration board to analyze the value and effectiveness of each metric, including existing metrics on the Summary Report page. During these key steps, I was in close contact with TMEs, Engineers and the PM to ensure that the content-based goals were met.
Design
Under the design phase, there was a heavy emphasis on componentizing the page. I started designing close to the content analysis stage, and as a result, began populating mockups with dummy data. As time progressed and more content and metrics were finalized, the designs increased in fidelity. Many hours were spent in critique sessions and syncs with the design system team.
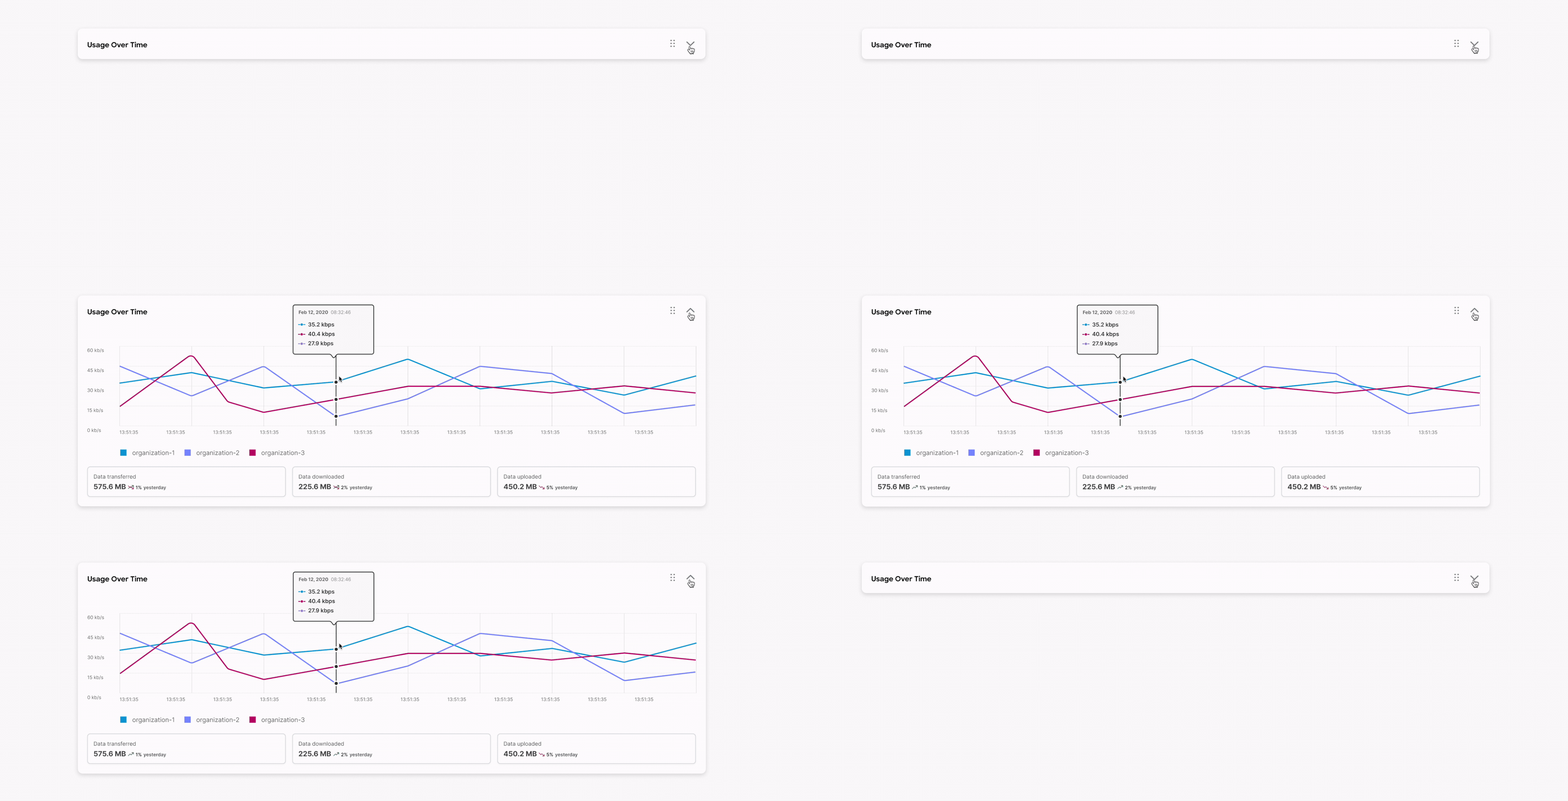
View all metrics and options at once
I strived to achieve a balance between allowing users to see all possible options and controls on screen, while also maintaining relatively low load times. As a result, the collapsed menus are always visible on screen, but are only loaded once expanded.
Customizability
As this platform is targeted towards a large group of users, it was important for us to ensure that the page was as general as possible, while also hitting all the customer’s requirements. In some cases, we found that some customers value a metric a lot more than others.
As a result, we decided that it would be best empower users to decide what metrics they would like to see on their screen, and at what level of priority through collapsible metric components.
Printing and sharing capabilities
Many users arrive at reporting pages solely to save or print, with the goal of sharing the metrics with their teams. As a result, we implemented 3 functions: print, and download as CSV/PDF.
Next steps
Although I worked on this project as an intern, I continue to make an impact on the decisions related to this product 2 years later. In the next few months, we hope to conduct research across a large group of customers to better validate our decisions of displaying certain metrics over others.


